I created a way to help fellow food delivery riders to track their earnings and performance. It is totally free and all you need is a Google account, some knowledge of Google Sheets and Google Datastudio.
Let's get started.
First, here are the metrics that I wish to track
- Pay per hour (PPH)
- Pay per delivery (PPD)
- Pay per distance (PPK) - this is optional as it needs manual intervention.
I would also like to know at any given time period
- Total payout
- Total deliveries
- Total distance - only shown if you add the distance traveled manually.
- Week with highest deliveries
All the raw data can be obtained from your rider app, regardless of platform, Foodpanda, Grab or Deliveroo.
Step 1: Create a blank spreadsheet with three tabs, "Shifts", "Weeks" and "Distance".
Go to https://sheets.google.com and sign in with your Google account. As you may already know, almost all the food delivery companies measure performance in intervals of weeks. The Shifts tab will be used to record the raw data and the Weeks tab used to aggregate the raw data into a weekly summary. The Distance tab is optional if you would also like to record the distance traveled between deliveries. I've embedded a template below for you to download.
📌 LINK TO SPREADSHEET (please go to File --> Make a copy to get your copy)
Step 2: Enter data.
Enter data from your app to the yellow-coloured columns. For the other coloured columns just copy from the previous cells and the formulas associated with those cells will be replicated.
Step 3: Link your sheets to Google Datastudio.
Go to https://datastudio.google.com and sign in with your Google account. If you are not familiar with this tool, don't worry, just make a copy of the template below.
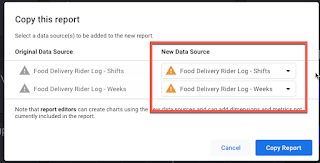
To make a copy do this:
- From the top right, click on Share --> Make a copy
- Link to your own copy of the spreadsheets mentioned in steps 1 and 2.

The data on the performance dashboard is pretty self-explanatory, and you can adjust the time range from the top right dropdown date picker.
Let me know what you think and if this is useful for you.
❤️ Bernie
No comments:
Post a Comment
Note: Only a member of this blog may post a comment.